
Syllabus- Data Analysis – Analytical Interpretation of statistical Data, Study of Graphs and Charts – Bar graphs, Line graphs and Pie- charts and drawing conclusions
Number of questions- Mains: 15
Mains Questions of the day-
Study the following table carefully and answer the given questions:
| Mobile | Cost Price | Selling Price | % of Profit | Profit |
| Samsung | 35,000 | —- | —- | 3,500 |
| Apple | 53,000 | —- | 14% | —- |
| Micromax | —- | 22,000 | —- | —- |
| LG | 28,000 | —- | —- | —- |
| HTC | —- | 33,000 | 10% | —- |
| Sony | 32,000 | —- | —- | 4,000 |
1.What is the selling price and % of Profit of Sony Mobile?
- 36,000 and 12.5%
- 36,00 and 15%
- 36,000 and 18%
- 36,000 and 20%
Answer: A
Explanation:
Selling price = 32,000+4000=36,000
% of Profit = 4000/36000 = 12.5%
2.What is the % of Profit Micromax, If Cost Price of Micromax is 3/5 of Cost Price of HTC mobile ?
- 33 1/3%
- 26 4/9%
- 22 2/9%
- 24 5/9%
Answer: C
Explanation:
HTC mobile Selling Price = 33,000
HTC Mobile % Of Profit = 10%
means 33,000 ——- 110%
? ——- 100% (CP)
Cost Price of HTC = 30,000
Micromax cost price = 3/5 *30,000 = 18,000
Selling price = 22,000
profit = 4,000
% of profit = (4000/18,000) *100 = 22 2/9%
3.If profit is 500 more than the profit of Samsung mobile then, What is the selling price and % of profit of LG mobile?
- 32,000 and 14 1/7%
- 34,000 and 14 4/7%
- 32,000 and 15 2/7%
- 32,000 and 14 2/7%
Answer: D
Explanation:
Profit on Samsung mobile =3,500
from that profit on LG mobile = 3500+500=4000
Selling Price of LG mobile = 32,000
% of profit on LG = (4000/28,000)*100 = 14 2/7%
4.What is the profit earned on Apple mobile?
- 7360
- 7450
- 7420
- 7560
Answer: C
Explanation:
Cost Price = 53,000
% of profit = 14%
53,000 ———— 100%
? ———– 114%
Selling price = 60,420
profit = 60,420-53,000=7420
5.What is the ratio between Cost Price and Selling price of Samsung?
- 14:15
- 10:13
- 10:14
- 10:11
Answer: D
Explanation:
Cost Price = 35,000
Selling Price = 35,000+3500=38500
Ratio = 35000: 38500 = 10:11
DIRECTIONS for questions: Study the following graph and answer the questions that follow.
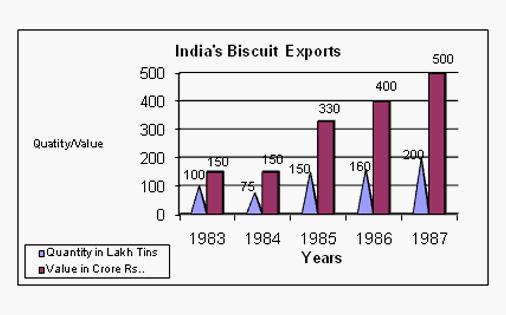
6.In which year was the value per tin the minimum?
- 1987
- 1984
- 1985
- 1983
Answer : D
Explanation:
In 1983, value per tin is 150/100, which is the lowest for all the years.
7.If in 1986 tins were exported at the same rate per tin as in 1985, then what would be the value of exports in 1986? (Crores of Rupees)
- 400
- 420
- 375
- 352
Answer: D
Explanation:
Value in 1985: 330/150 = 2.2.
Value in 1986: 160 x 2.2 = 352.
Hence option E
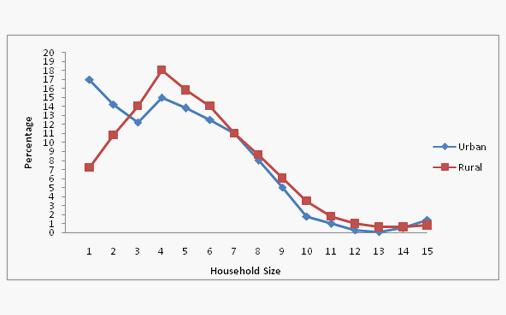
DIRECTIONS for questions: The percentage distribution of households by household size and the average sizes of household in.
- All India Rural and Urban areas.
- Urban areas classified as per population size are presented below.
| All India | Distribution of People | Average Size of Household |
| Rural | – | 5.08 |
| Urban | – | 4.60 |
| Distribution of Urban | Below 15, 000 | 4.75 |
| 15, 000 – 50, 000 | 4.50 | |
| 50001 – Above | 4.70 |
8.In rural areas, which one of the following sizes of the households is the highest in number?
- 15
- 2
- 3
- 4
Answer: D
Explanation:
From the graph, we see that the line for rural peaks at about 4-5.
Hence the best answer is (4).
9.In urban areas, among the households of different sizes, what is the percentage of households of size 5 or less?
- 13
- 72
- 36
- 87
Answer: B
Explanation:
Total up the number of households ≤ 5 are 17 + 14 + 12 + 15 + 14 = 72.
10.As the urban population of towns increase, what is the average household size?
- Increases
- Decreases
- remains constant
- Fluctuating
Answer: D
Explanation:
As population size increases, we see that household size is 4.75, 4.50, 4.70.
Hence the values are fluctuating.
Directions: Study the following the pie-chart and table carefully to answer the questions given below:
The following pie-chart shows the distribution of the monthly family budget of a person.
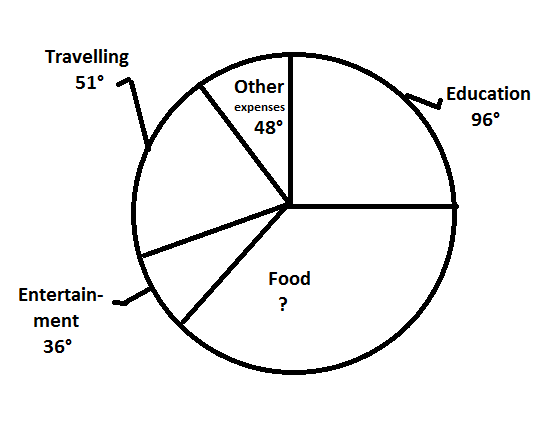
The following table shows the further distribution (in percent) of the above-mentioned items among the five family members i.e P (the person himself), W (his wife), Rahul (son), Rohit (son), and Preeti (his daughter). His monthly family budget is Rs. 1,20,000
| Education | Food | Entertainment | Travelling | Other expenses | |
| P | 10 | 30 | 10 | 40 | 20 |
| W | 15 | 25 | 30 | 10 | 25 |
| Rahul | 40 | 20 | 20 | 25 | 20 |
| Rohit | 25 | 15 | 25 | 10 | 10 |
| Preeti | 10 | 10 | 15 | 15 | 25 |
11. What is the average expenses of P?
- Rs. 5620
- Other than the given options
- Rs. 5640
- Rs. 5460
Answer: D
Explanation:
Average expenses of P
= (10% of (96/360) + 30% of (129/360) +10% of (36/360) +40% of (51/360) +20% of (48/360)) * (1,20,000/5)
= ((960+3870+360+2040+960)/3600) *(1,20,000/5)
=Rs.5460
12. What is the approximate percentage increase in the amount Which Rahul enjoys for entertainment as compared to Preeti for the same?
- 33%
- 31%
- 3. 35%
- 37%
Answer: A
Explanation:
Amount spent by Rahul on Entertainment
(20/100) *(36/360) * 1,20,000
=Rs.2400
Amount spent by Preeti on Entertainment
= (15/100) *(36/360) *1,20,00
=Rs.1800
∴ Required percentage increase
= ((2400-1800)/1800) * 100
=33%
13. The average expenses of Rohit is approximately what percent of the average expenses of W (Wife)?
- 76.4%
- 81.5%
- 3. 79.5%
- 4. 83.5%
Answer: D
Explanation:
Average expenses of Rohit
= (25% of (96/360) + 15% of (129/360)+ 25% of (36/360)+10% of (51/360)+10% of (48/360))*(1,20,000/5)
= ((2400+1935=900+510+480)/36000 * (1,20,000/5))
=Rs.4150
Average expenses of W (wife)
= (15% of (96/360) +25% of (129/360) + 25% of (129/360) + 30% of (36/360) +10% of (51/360)+ 25% of (48/360) * (1,20,000/5)
= ((1440+3225+1080+510+1200)/36000) *(1,20,000/5)
=Rs.4970
∴ Required percentage
= (4150/4970) *100
= 83.5%
14. Find the difference (in percentage of the budget) between the average expenses of Education and the average expenses on Entertainment of the couple?
- 1.3%
- 0.9%
- 3. 2%
- Other than the given options
Answer: A
Explanation:
Required difference
= (((10+15) of (96/360))-((30+10)% of(36/360))* (1,20,000/2)
= ((2400-1440)/36000) *(1,20,000/5)
=Rs.1600
∴ Required percentage = (1600/1,20,000) *100=1.3%
15. The total amount spent by Rahul on Travelling and Food is approximately what percent of the total amount spent by Preeti on Education and Food?
- 159%
- 168%
- 171%
- 175%
Answer: C
Explanation:
Required percentage
= ((20% of (129/360) +25% of (51/360)) / (10 % of (96/360) +10% of (129/360))) *100
= (((20*129) + (25*51))/ (960+1290)) *100
= ((2580+1275)/ (960+1290)) *100
= (3855/2250) *100=171%